Navigation Timing
Navigation Timing API Explained
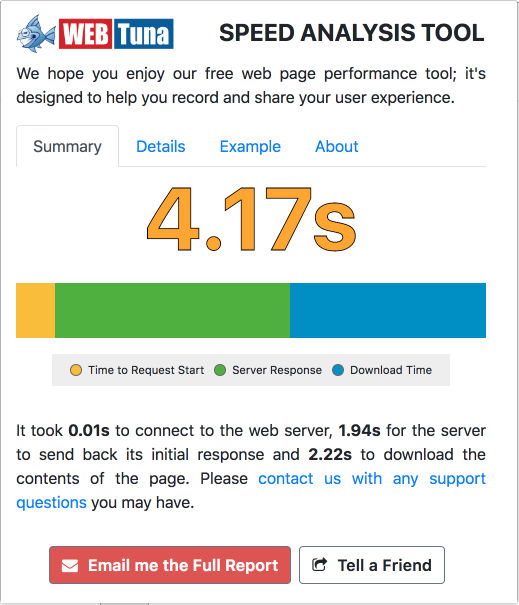
The Navigation Timing API provides data that can be used to measure the performance of a web site. Unlike JavaScript-based libraries that have historically been used to collect similar information, the Navigation Timing API can be much more accurate and reliable. These days the vast majority of browsers support Navigation Timing and this is what both WebTuna and our FREE WebTuna Speed Analysis Tool for Chrome use to measure page performance.
Web performance has always been challenging, but in today’s world, it’s harder than ever to have a good, interactive site, while retaining fast load times. Firstly, we have the evolution of digital media, where we’ve gone from dull, vanilla websites of the late 90’s to today’s dynamic, interactive, socially-connected multi-media sites.
We, as end users have also turned into impatient, “we want it now" customers expecting full-on media or social interaction along with pages that load in under 3 seconds. Web performance, its impact on online sales and conversion goals are well documented and proven. Introduce mobile devices with typically slower internet connections, and the challenge becomes harder to achieve.
Studies have shown that consumers start becoming impatient when pages take longer than 2 seconds to load, with nearly 50% expecting a page to load in 2 seconds or less. If your solution is e-commerce-based, page load performance will also impact customer loyalty, with delayed customers either becoming distracted, going to a competitor, or abandoning their intentions altogether.

Try it Now
Performance Timing Events
When a web page loads, behind the scenes there is a sequence of events that occur. As these take place, step-by-step the requested web page is built up in the end-users browser. The diagram below shows main events within a page load. Below is a basic overview of what our speed analysis tool is telling you.
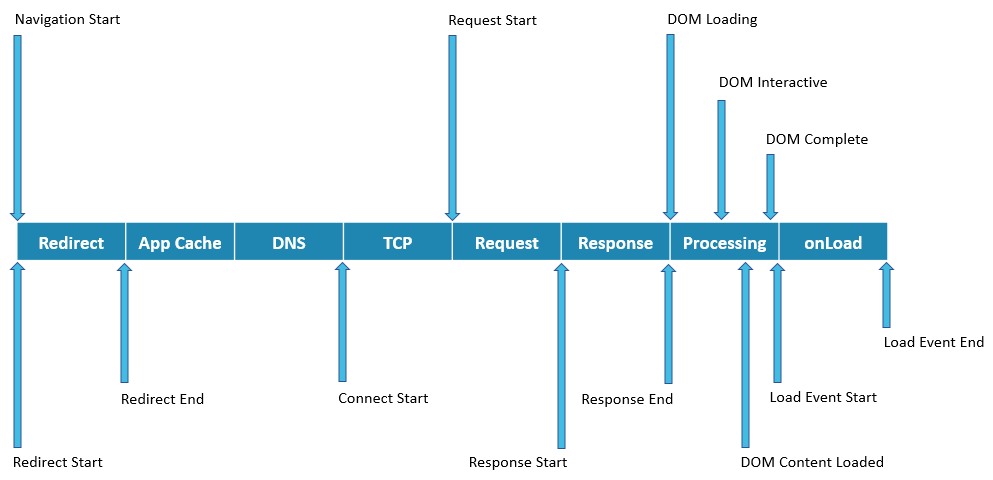
High-level performance timing events diagram
Pre-Request
Pre-request is calculated by subtracting the navigation start from the request start time (calculated by requestStart-navigationStart).
When a user enters a website domain into their browser and hits enter, a DNS resolution process is triggered where the domain entered is resolved to it’s IP address. This process normally takes a few milliseconds but can quickly add up when multiple redirects are triggered – when this occurs the page overhead is increased and the page load is delayed further.
Typical triggers for redirects are, for example, sending users from a desktop to mobile version of a website, e.g. yourdomain.com to m.yourdomain.com, redirecting users to secured pages, to latest versions of content or to content for the end user’s geo-location.
Our top recommendations are to review your overall page load requests and see how many requests are taking place. If you have redirects ask yourself if they’re needed – are they valid, can they be reduced and are you experiencing any redirect loops.
- Do not use a low TTL (time to live) – the shorter the time, the sooner the end user’s device will need to query DNS again for the domain whilst a higher duration will cache it longer locally. Consider how long you could set it to, would 60 minutes or potentially even a day be acceptable?
- Capacity management – popular websites receive many DNS requests so make sure you have the capacity on your infrastructure, or let someone else manage your DNS for you. There are plenty who will, two such companies are CloudFlare or Dyn.
- Too many CNAMES can delay DNS lookups – domain name aliases (canonical name records) add another level of indirection using DNS lookups. The overall impact should be minimal but make sure there aren’t multiple CNAME lookups occurring too often.
- Exotic domains may impact lookup times – specialist domains such as “.photography" authoritative servers are often far away from your end user’s ISP impacting performance and introducing a level of redundancy risk.
- Distributed DNS – will help lookups from a geographical location; time is saved if a UK based user’s DNS lookup is being answered in the UK rather than the US.
- Unreliable registrars – make sure your registrar’s DNS servers can handle your expected website load, if not again you should look to outsourcing the DNS management.
- DNS redundancy – always plan for the worst and be pro-active and implement a DNS redundancy plan. Without this, should DNS go down, so in effect does your website.
For further information do read Wikipedia’s explanation of how DNS works, there are also plenty of DNS lookup tools out there but one straight forward example is Google’s offering.
HTML Download
HTML download is the time it takes for your web browser to download the request objects such as the HTML code, CSS, JavaScript, images etc.
The start time of the response value represents how long it took to receive the first byte from the request. Poor load distribution can be a root cause of this. If too many people are on the same server performance issues are going to occur. This applies even if the overall solution is under capacity. You can identify this by analysing individual server loads within your infrastructure via load testing and APM tools and solutions such as AppDynamics or turbonomic. Other classic pitfalls are:
- Optimising images – make sure images used are optimised for the web. A classic culprit of this are CMS solutions where content editors set large 2mb images onto their company’s homepage.
- HTTP compression – while it introduces a slight overhead on the web servers themselves the benefits easily outweigh any penalty. It’ll reduce your bandwidth and reduce the size of the content being sent back to the web browser.
- Minification – combine and minify your CSS and JavaScript files. Doing this will help reduce the total number of requests and their total overall size.
- Sprite sheets – use sprite sheets for common icons and logos used on your website, there are plenty of online tools to help you create these.
DOM Loading
The DOM loading event gets triggered before the user agent sets the requested page readiness to loading status, and it represents when the browser is about to do something with the requested web page.
DOM (Document Object Model) represents a page enabling programs to change the document’s structure, style and content. The quicker the DOM is ready the faster the end user’s interaction with the web page will be so blocking or slow requests need to be identified and resolved. The root cause of slow DOM times tends to be code – or to be more specific, client-side code. In today’s development world, there are multiple JavaScript tools / libraries such as jQuery that help simplify the accessing of the DOM.
If you’re experiencing slow DOM times consider what the JavaScript code is doing. Do you have too many selectors, unnecessary loops and if you are indeed using a library think about whether you really need to as pure JavaScript will be quicker.
- Use a profiler to identify the issue – for “how to" for Chrome see their analyse runtime performance document or click Firefox, IE or Edge.
- Be aware of DOM libraries and don’t use them out of habit – often developers are creatures of habit and one such habit is using the same libraries and tools. One example of this is jQuery – it is great! – but it doesn’t necessarily need to be used. These libraries and tools sit on top of frameworks and whilst they help ease access and speed development, they’ll rarely be as quick as the original framework itself.
- Minimise re-draws or re-flows – don’t change the state of the UI whilst that DOM is in the document. If you need to, then reduce the impact by using document fragments.
A great demo of the performance difference of JavaScript vs. a library can be seen at http://jsfiddle.net/VWkS2/2/.
Further Reading
Our speed analysis tool for Chrome uses the W3C Navigation Timing Level 2 specification. You can read more about the specification via the link https://w3c.github.io/navigation-timing. If you would like to know more about our speed analysis tool, please visit our dedicated page Speed Analysis Tool for Google Chrome. Or click the button below to install it for Google Chrome.
Try it Now
Suggest a Feature
To suggest a new feature or improvement, please complete the form on this page and we will review and get back to you as soon as possible.