
WebTuna Alerting on Page Load Time
We are are pleased to announce that WebTuna now has built-in alerting for all customers who need to be notified when performance of their web site goes bad. This has been one of our most requested features for some time.
In this first release of alerting customers can now receive email notifications when the average page load time for their site goes beyond the target threshold they define.
Once enabled, you will receive an email notification each time your web site performance goes bad and another email letting you know once things are back to normal. You can see below example emails showing the start and end of an SLA violation. The emails also contains a deep link back into WebTuna to investigate the problem further.
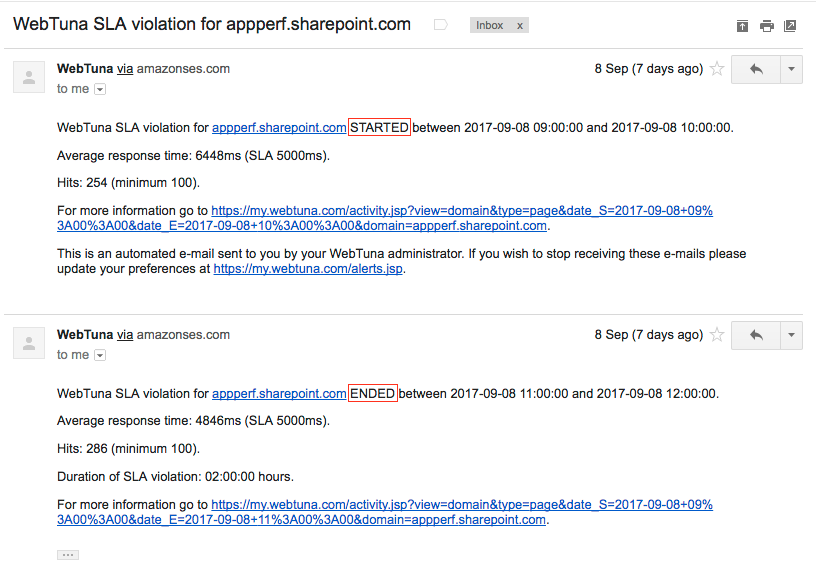
You could even set these alerts to go to the email address of your support ticketing system and have then automatically open a ticket for the incident.
Setting appropriate target page load time
For customers to benefit from alerting it is important that their target page load times are set to an appropriate value by the WebTuna Admin user. This can be done in the Domain Target Page Load Time section of the Admin area shown below.
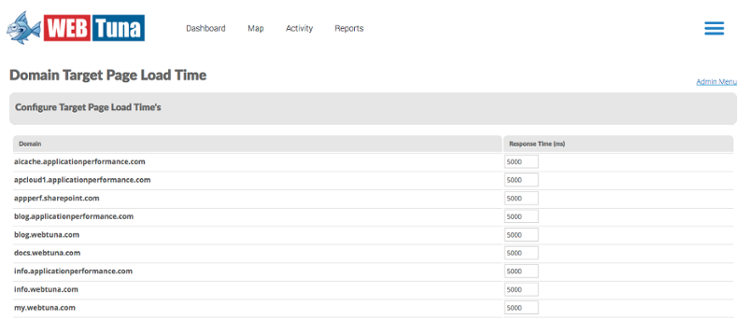
If you haven’t read our recent blog post, ‘Seeing Red‘ then we suggest you read this first, to make sure your target is set to an appropriate value for your site. The default value is 5000ms or 5 seconds but this is not good for all cases. Some customers will want to reduce this for their sites while others may need to increase the value. If for example your site has an average page load time of 7 seconds and the target is 5 seconds then your alert would fire once and then remain in violation forevermore.
Avoiding false alerts
Real user monitoring data is inherently ‘noisy’ since user’s can get a whole variety of different page load timings for the same page even on the same browser and connection depending on whether things are cached in their browser and the conditions at that moment in time on the device, network and server. Therefore with alerting it is important that we don’t alert based on a ‘handful’ of slow requests which skew the overall average. For this reason, WebTuna evaluates a whole hour of data and requires a minimum of 100 data points for an alert to trigger.
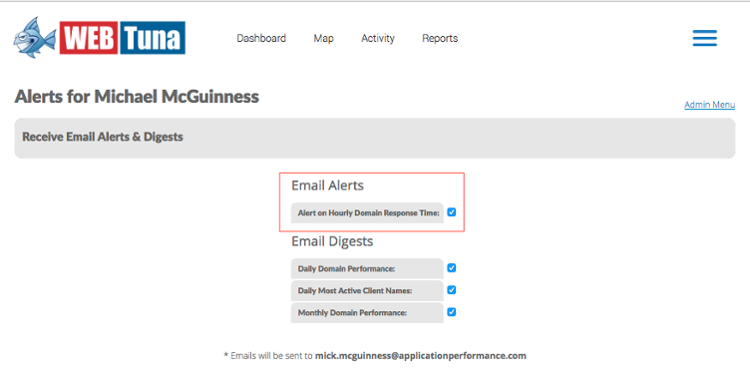
How to turn on Alerting
In the Admin section, any user whether they are a WebTuna Admin or Regular user, can choose to enable alerting. This is as simple as ticking the box as shown below. WebTuna Admin users can also turn on alerts for other users within their organisation by going to the View/Add/Edit/Delete Users screen editing a specific user.
The future of alerting
Currently alerting is based on Average Page Load Time but in the future we will provide alerts based on other measures as well, for example Apdex score , a measure of end user satisfaction which is already displayed in other parts of WebTuna. We could also look at detecting deviations from baseline performance rather than static thresholds. Let us know if you have any feedback or suggestions.