How is WebTuna different to Google Analytics
The data provided by Real User Monitoring (RUM) and Web Analytics often crossover and sometimes there is confusion about whether you need one or the other or both. Quite often the users of the data is different with Web Analytics mostly appealing to the Marketing team and the Real User Monitoring data being used by Ops and Dev to track and improve the site’s performance.
What is Real User Monitoring (RUM)?
Real User Monitoring or RUM (pronounced like the alcoholic beverage) is an approach to Web monitoring that aims to capture and analyse every transaction of every user of your website or application. It is sometimes known as real user measurement, real user metrics, end-user experience monitoring (EUM) or End user experience monitoring (EUEM). It is a form of passive monitoring and should not be confused with Synthetic web site monitoring which actively tests the availability of a site using a test agent/probe/robot.
In the past RUM was often done using expensive hardware appliances connected to a network tap or Span/Mirror port on a Switch to see the HTTP traffic into the web servers. This method often missed data since many of the page resources these days are served from third party sites, internet caches or content delivery networks (CDN) so the appliance in the data centre would not see them. These days almost all RUM vendors use a JavaScript snippet added to the pages to gather their metrics which has the advantage of being able to see the request from the perspective of the end user’s browser. In recent years almost all browser vendors have added support for the Navigation Timing API, which is a standard for exposing timing information from the browser and this is what most RUM tools utilise to gather their metrics.
What is Web Analytics?
Web analytics is the measurement, collection, analysis and reporting of web data for purposes of understanding and optimising web usage. Web analytics is not just a tool for measuring web traffic but can be used as a tool for business and market research, and to assess and improve the effectiveness of a website.
In the past web analytics was done using the web server log files. For web servers like Apache. NGinX or IIS there are numerous tools, mostly free, which can ingest the access or error logs and produce reports about the number of hits by browser, IP, URL and so on. These days however the most common Web Analytics tools vendors use a JavaScript snippet added to the pages to gather their metrics.
Similarities and differences
So although the method of data capture is the same (JavaScript snippet added to page), there is usually a difference in focus: RUM-specific software focuses on analysing site performance from the user’s perspective, while web Analytics focuses more on profiling the users themselves and their behaviour.
WebTuna – a hybrid approach
With WebTuna we have always referred to our style of RUM as “Web Performance Analytics or “Web usage and performance analytics”. This was a deliberate choice we made when we set out to bring the benefits of Web Performance monitoring and Web Analytics in a single solution.
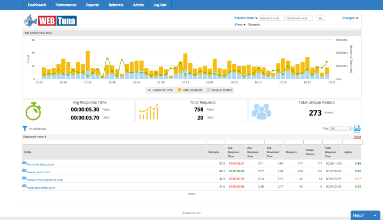
With that said we are first and foremost a RUM tool with performance as a focus but we do have many of the analytics features that other RUM tools don’t have. The reason for this is the unique way we collect and store every page view or user interaction from every user and store the timing information for it. This allows us not only to be able to break down performance by page like other RUM vendors but also to see the number of hits and unique visitors by Site, URL, Page, Browser, OS, User, Session, Country, Continent, IP address, ISP, Referrer and more!
WebTuna vs Google Analytics Feature comparison
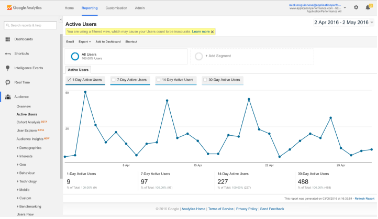
Google Analytics is a a web analytics tool from Google which provide some but not all of the information WebTuna provides.
| Feature | Google Analytics | WebTuna |
|---|---|---|
| Real time data | Most data is only available after 24 hours | All data is real time, even for the users still on your site |
| Every page view recorded | For busier sites takes a 10% sample by default | Captures 100% of page views |
| Page timing | Only for newer browsers supporting Navigation timing API | Supports all browsers including older browsers like IE6,7 and 8 and Safari which don’t include Navigation timing API |
| Unaggregated data | All data is aggregated hourly or daily | All data is stored unaggregated for 40 days meaning you can drill down to individual user sessions when troubleshooting |
| Average performance measurements | Shows averages which can often mask problems | Can see the full distribution of page load times and not just averages meaning it can spot problems that others would miss |
In Summary
- Google Analytics doesn’t measure performance metric for browsers which don’t support Navigation Timing API (e.g older browser like IE6/7/8, Safari and others).
WebTuna captures page timings for all browsers supporting JavaScript which is almost all of them. - Google Analytics only samples 10% by default.
WebTuna captures 100% of page views. - Google Analytics has some real time stats but not for performance.
WebTuna has real time data for everything including page performance. - Google Analytics only shows aggregated data.
WebTuna stores every page view from every user so you can keep drilling down and slicing the data as you like and can even drill down to an individual IP or user session. - Google Analytics data retention is only for rolled up data
WebTuna stores raw unaggregated data for 12 months - Google Analytics only shows average for performance which can be misleading. Averages often mask problems.
WebTuna can show the histogram of response times so you can see the spread of response times and any outliers.


